Home > Portfolio

The Brief
Arizona Engineering Services, a subsidiary of Arizona Group of Companies, would like more insights into workplace diversity and employee demographics.
As their BI Analyst, management would like you to analyze human resources data and develop reports and dashboards to answer the following questions;
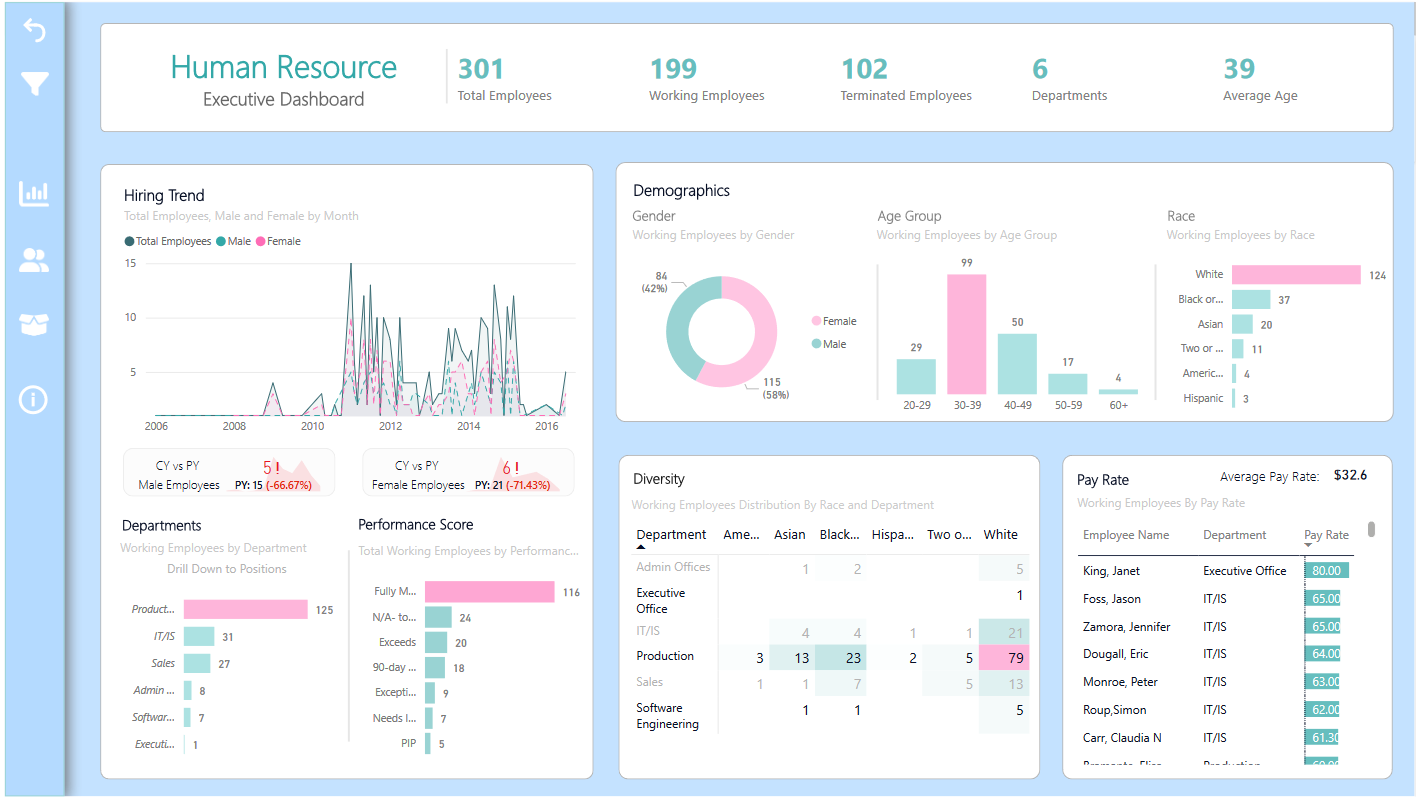
- Is there gender equality in employee recruitment?
- Is there diversity in the workplace?
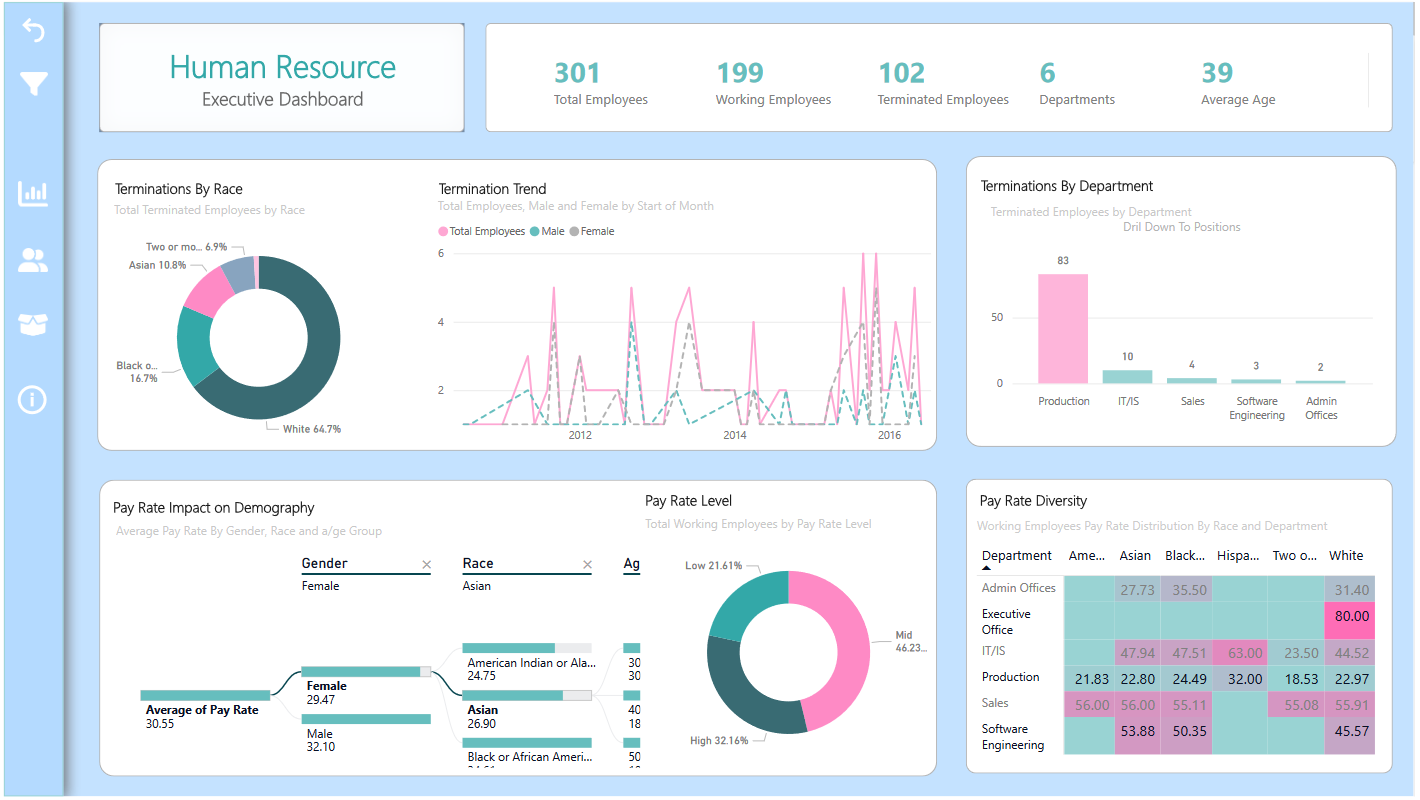
- What demographics are more impacted by low pay rates?
- Identify the trends and patterns in the hiring process.
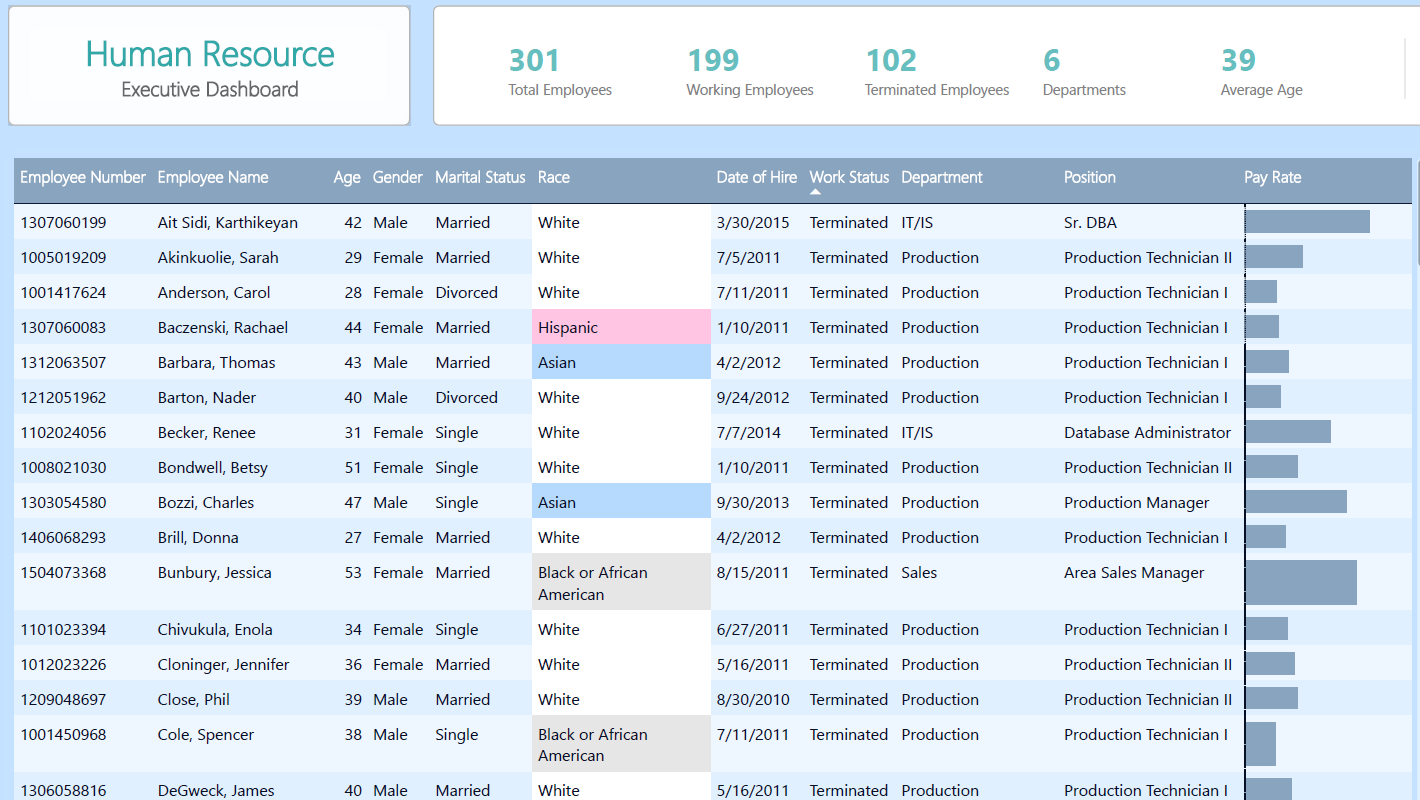
- Analyze data across various other factors.
- Write an executive report showing key insights and recommendations.
Tools: POWER BI
Process and Implementation
Data Exploration
- Data Definition: Table & Columns Definition (not included in the demo).
- Dataset: HR_Data.xlsx
Dashboard Planning
Dashboard planning is critical to delivering clear and valuable insights to stakeholders.
We would follow the steps below;
- Understand the needs, requirements, and goals of business users.
- Explore the data and prioritize business needs.
- Define the purpose, audience, and consumption.
- Choose the right metrics.
- Choose the right charts, filters, colors, fonts, and icons.
- Develop a wireframe and mockup.
- Eliminate noise – anything that takes up space and doesn’t add value. For example, excessive colors, background images, grid lines, and 3d charts.
- Design layout to focus attention – use size and color to drive attention, group related elements, z or f reading pattern on chart importance.
- Use descriptive data labels to tell a story.
- Optimize for multiple devices.
Data Modeling and Transformation
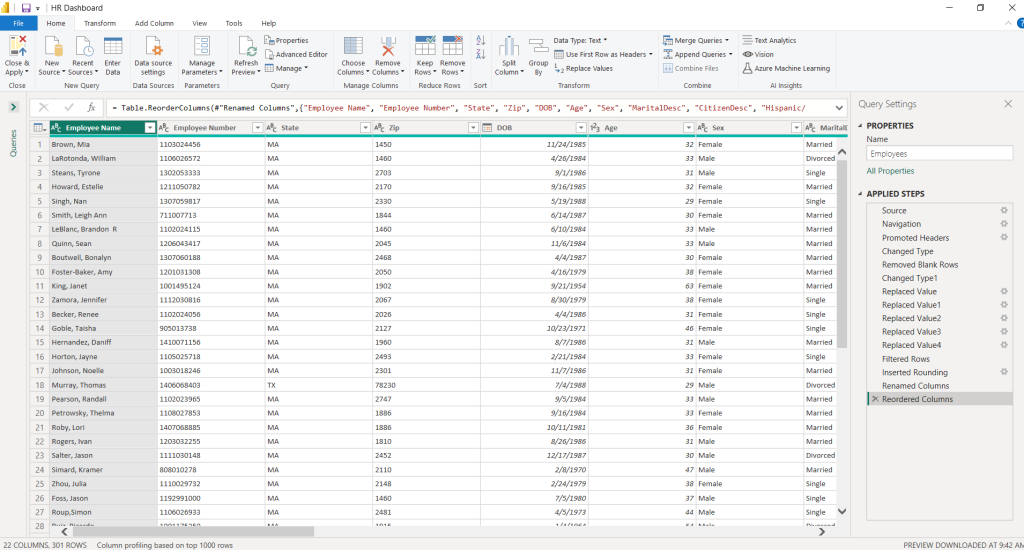
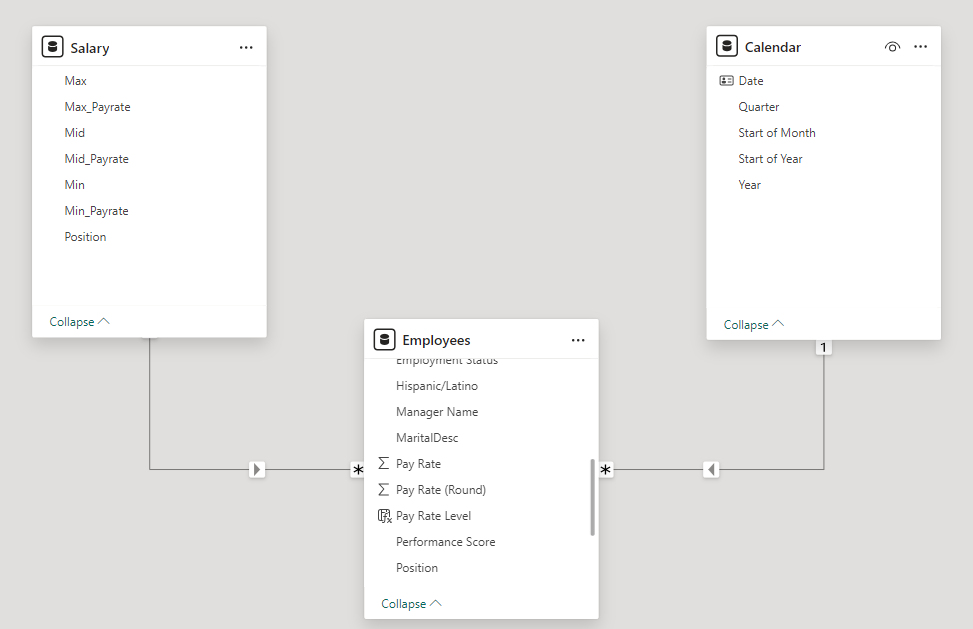
Data modeling was done in Power BI while cleaning and transformations were done using Power Query. Various measures and calculated columns were also created.
Cleaning and transformations carried out include;
- Changing data type
- Removing blank rows
- Checking for duplicates
- Replacing values with inconsistent formatting
- Renaming columns
- Reordering columns
Calculated columns created include;
- Working Status – separates terminated and employed staff.
- Pay Rate Level – categorizes low, mid and high-income earners. Values used include >= $40 for high, >=$20 for mid and lower for < $20.
- Age Group – grouping the different age ranges.
Measures created include;
- Average Age
- Average Pay Rate
- Previous Year Employees
- Previous Year Male Employees
- Previous Year Female Employees
- Total Departments
- Total Male Employees
- Total Female Employees
- Total Working Employees
- Total Working Male Employees
- Total Working Female Employees
- Total Terminated Employees
A calendar table was created to implement time intelligence.
The Dashboard
